What Is Dollar-Cost Averaging?
Dollar Cost Averaging is a strategy that is used to systematically purchase an amount of stocks or shares of securities products, such as a mutual fund or a portfolio fund, to offset investment risk in a market that is fluctuating. Put simply, you keep investing the same dollar amount every month or every fortnight to buy the same shares. If the share price goes up, you buy fewer shares. If the share price goes down, you buy more shares.
Why Dollar-Cost Averaging?
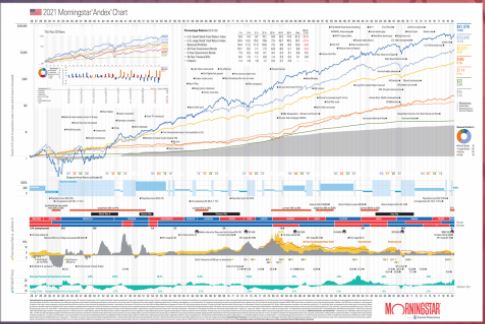
Most people would like to be able to predict or beat the stock market, but the market will continue to do what it has done over the years, which is, changes all the time. Over the past 100 years the price of stocks changes everyday, they went up and down and up and down. But as it fluctuated
over and over again, it has historically moved up over time. The Andex chart below that shows how the stock market changes over the years will attest to this.

The reason why many people lose money in the stock market is because they’re emotional investors. They’re just interested in short-term gains, which is rarely consistent, and they forget about the long-term growth potential.
Emotional investing often leads to lower returns because when emotional investors see the market goes up, they’ll enter the market without knowing that they are buying high. And when the market goes down, they panic and get out of the market, selling low. Unfortunately, many times when they get out, the stock may have hit bottom and begin to move up again.
Studies have shown that in the last 20 years investors who bought and sold in and out of the market based on their emotions had an average 4.3% annual return. During that same period, investor who use the “buy and hold” investment strategy in the S&P 500 Index averaged 8.2% annual8 return.
An Example Of Dollar-Cost Averaging
Suppose you decided to invest $200 in the stock market each month. The table below will help you to better understand the concept of dollar-cost averaging.
| Monthly Contribution | Price per unit | # of units accumulated | |
| Month 1 | 200 | 100 | 2 |
| Month 2 | 200 | 50 | 4 |
| Month 3 | 200 | 25 | 8 |
| Month 4 | 200 | 20 | 10 |
| Month 5 | 200 | 50 | 4 |
| Month 6 | 200 | 100 | 2 |
| Total contribution= $1200 | Total # of units accumulated = 30 |
After 6 months the total number of units you will have is 30 and the total amount invested is $1200.
Now suppose at the end of the 6 months you decided to sell your units. The value of each share at the end of 6 months is $100. So if you sell your 30 units you will receive $3000 = (30 x $100).
Your return, as an amount, on investment in this example would be $1800 = $3000 – $1200. Your return, as a percent, on investment would be:
1800/1200 * 100 = 150%
While this is just a simple example for illustration purposes only, some investors do in fact realize these returns over time. But they are rarely the emotional ones. It all comes back to consistency. If you are consistent in your actions the rewards are usually greater than when you’re inconsistent.
Now that you understand dollar-cost averaging and a bit about the history of the stock market performance, there’s absolutely no reason to be afraid of investing in the stock market or other types of securities if that is something you would like to do.
Instead of trying to time the market or listening to others, you can do your own due diligence to gain more understanding and employ strategies like dollar-cost averaging to invest with peace of mind.
Your content goes here. Edit or remove this text inline or in the module Content settings. You can also style every aspect of this content in the module Design settings and even apply custom CSS to this text in the module Advanced settings.

